
K-Means is an unsupervised machine-learning algorithm that partitions numerical data into K clusters. It repeatedly assigns each point to a centroid and updates those centroids to reduce variation within the clusters.
Before this lesson: Unsupervised Learning Explained introduces the broader idea of finding structure in unlabeled data.
In standard K-Means, “closest” has a precise meaning: the algorithm minimizes the sum of squared Euclidean distances between data points and their assigned centroids. The resulting groups are mathematical partitions—not automatically meaningful customer types, medical categories, or real-world explanations.
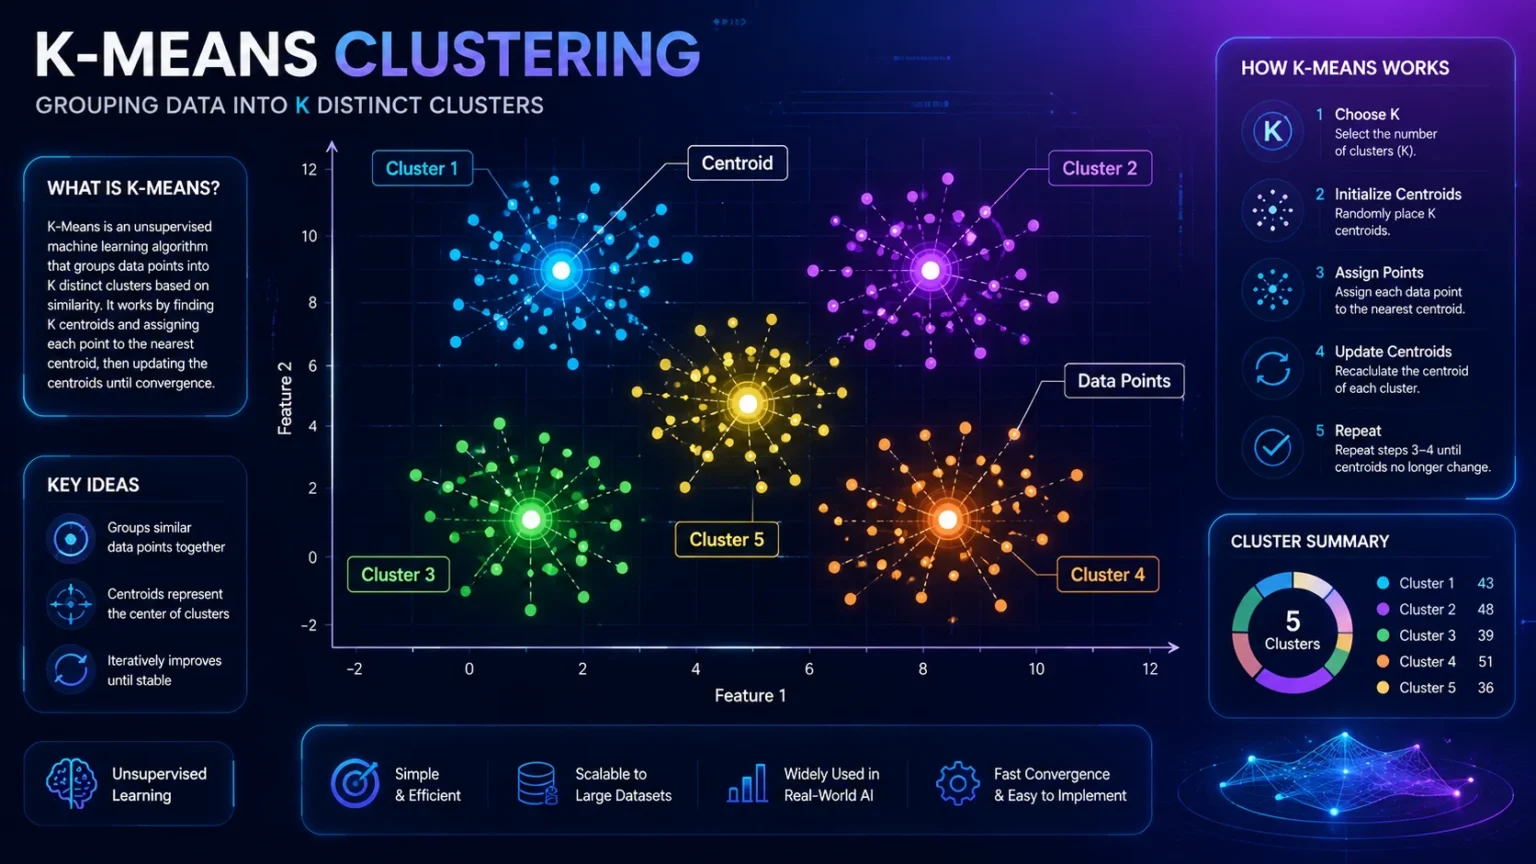
Open full-size diagram
How K-Means works
A centroid is the calculated mean position of a cluster in feature space; it does not have to be an actual observation in the dataset.
Convergence means the current run has stabilized. It does not prove the globally best clustering was found. Different initial centroids can lead to different local solutions, so implementations commonly use K-Means++ and compare multiple runs.
A small worked example
Suppose a one-dimensional dataset contains the values 1, 2, 3, 10, 11, and 12, and we choose K = 2. If the initial centroids are 2 and 11, the first three values are closest to 2 and the last three are closest to 11. Recomputing the means gives centroids of 2 and 11 again, so this run is already stable.
This tidy example has a clear gap. Real data may overlap, contain outliers, use many features, or have no natural cluster structure.
What K-Means optimizes
The objective is often called inertia or the within-cluster sum of squares. It adds the squared distance from every point to its assigned centroid and seeks a lower total.
Lower inertia is guaranteed when K increases, because additional centroids provide more flexibility. That does not mean the largest possible K is best. K-Means does not directly optimize business value, class separation, causal meaning, fairness, or downstream usefulness.
Why preprocessing and features matter
Distance is calculated in the feature space you provide. If one feature ranges from 0 to 1 and another from 0 to 100,000, the larger-scale feature can dominate. Standardization or another justified transformation is therefore often important.
Feature selection matters just as much. Irrelevant, duplicated, highly correlated, or poorly represented variables can distort the geometry. Standard K-Means also relies on numerical means, so arbitrary categorical values should not simply be encoded as numbers and treated as Euclidean measurements.
In very high-dimensional spaces, Euclidean distances can become less informative, so feature selection, dimensionality reduction, or a different representation may help.
Preprocessing must be chosen for the data and interpretation rather than applied mechanically. See Data Preprocessing Explained and Feature Engineering Explained.
How to choose K
Elbow method
Plot inertia across several K values and look for a point where adding clusters produces diminishing improvement. The elbow is a heuristic, not proof of a uniquely correct K. Some datasets have no obvious elbow.
Silhouette analysis
A silhouette score compares how close a point is to its own cluster with how close it is to other clusters. It offers another perspective, but no single score establishes semantic usefulness.
Stability and domain validation
Compare results across samples, initializations, and reasonable preprocessing choices. Then ask whether the clusters are interpretable, useful for the intended decision, and stable enough to support that use.
When K-Means is a reasonable choice
K-Means is most defensible when the data is numerical, Euclidean distance is meaningful, the desired groups are reasonably compact in the selected representation, and a fixed partition into K clusters fits the purpose.
Possible applications include exploratory customer segmentation, grouping numerical behavior profiles, image color quantization, prototype compression, and summarizing sensor or operational patterns. Clustering can support fraud or recommendation workflows, but K-Means is not automatically an appropriate detector or recommender.
Swipe horizontally to view the full comparison.
| Area | Strength | Limitation or check |
|---|---|---|
| Computation | Often efficient on moderate numerical datasets. | Multiple runs and large K values increase work. |
| Interpretation | Centroids provide compact summaries. | Cluster labels and meaning require human/domain validation. |
| Geometry | Works well for compact Euclidean groups. | Can fail on elongated, nested, non-convex, unequal-density, or overlapping groups. |
| Data quality | Useful as an exploratory baseline. | Sensitive to scaling, outliers, irrelevant features, and unsuitable encodings. |
| Reproducibility | K-Means++ improves initialization. | Different starts can produce different local solutions. |
Common mistakes
- Treating every returned cluster as real. K-Means will produce K groups even when the data has no meaningful natural partition.
- Calling the elbow “optimal.” It is one heuristic among several forms of evidence.
- Ignoring scale and outliers. Both can move centroids and change assignments substantially.
- Using K-Means on unsuitable shapes. Compare alternatives when the geometry is non-convex or density varies.
- Assigning semantic labels too early. A cluster becomes “premium customers” only after its properties and usefulness are validated.
K-Means compared with related methods
Hierarchical clustering creates a nested grouping structure that can be displayed as a dendrogram, while K-Means produces one partition for a selected K. Hierarchical methods can be easier to inspect across multiple grouping levels; K-Means is often more scalable on larger numerical datasets. Read Hierarchical Clustering Explained.
K-Nearest Neighbors is different despite the similar name. K-Means is unsupervised clustering; KNN is a supervised method for classification or regression using labeled neighbors. See K-Nearest Neighbors Explained.
Sources and further reading
- scikit-learn: K-Means clustering
- Google for Developers: K-Means overview
- Google for Developers: Clustering workflow
Where to learn next
Compare K-Means with a method that builds nested groups instead of requiring one fixed partition.