Introduction: Why Accuracy Isn’t Enough
Imagine a medical AI that claims to be 95% accurate at detecting a disease.
Sounds impressive… right?
But what if that same model misses most of the actual disease cases?
Suddenly, that “95% accuracy” doesn’t feel so reliable.
This is exactly why we need tools like the confusion matrix.
Instead of giving you just one number, it shows:
- What your model gets right
- What it gets wrong
- And how it makes mistakes
If you understand confusion matrices, you’re already thinking like a machine learning engineer.
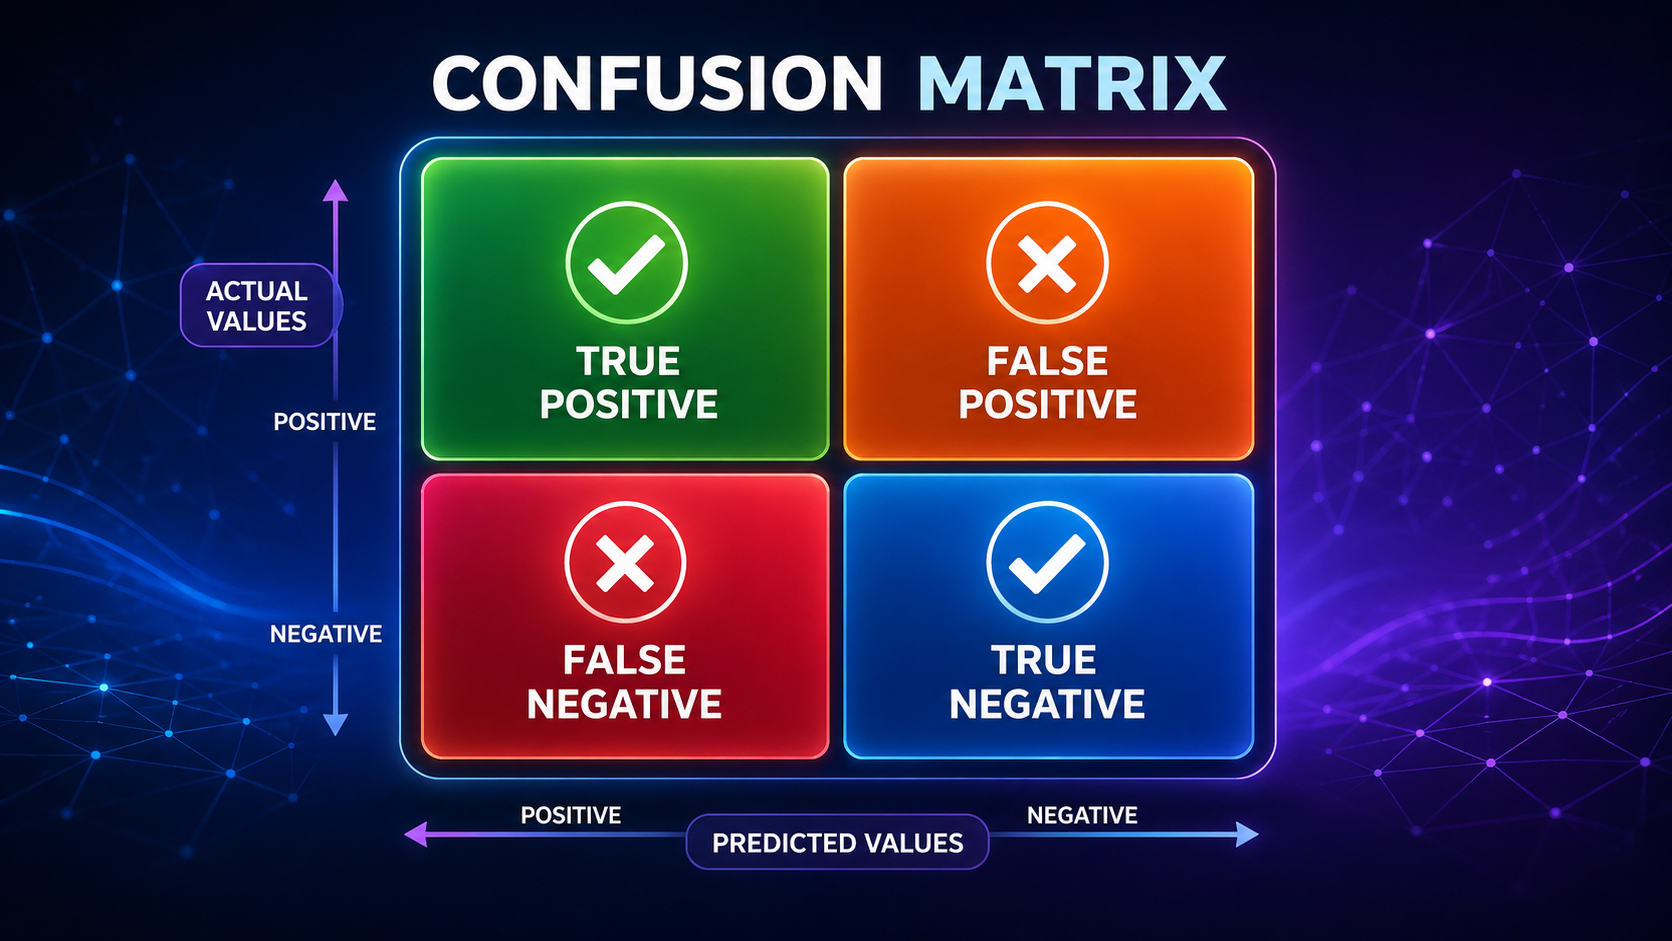
What Is a Confusion Matrix?
A confusion matrix is a table used to evaluate the performance of a classification model by comparing its predicted results with the actual outcomes. It breaks predictions into four categories—true positives, true negatives, false positives, and false negatives—giving a complete picture of how well a model performs.
Confusion matrices are important evaluation tools in machine learning and artificial intelligence because they help measure prediction accuracy, classification errors, and model reliability.
A confusion matrix is a table that compares:
- Actual values (what really happened)
- Predicted values (what the model guessed)
It is primarily used for classification problems, such as:
- Spam detection
- Fraud detection
- Disease diagnosis
Instead of summarizing performance with a single number, it gives a detailed breakdown of prediction outcomes, helping you understand exactly where your model succeeds and fails.
Basic Structure (Binary Classification)
| Predicted Positive | Predicted Negative | |
| Actual Positive | True Positive (TP) | False Negative (FN) |
| Actual Negative | False Positive (FP) | True Negative (TN) |
This simple 2×2 table gives you deep insight into model behavior.
How to Think About a Confusion Matrix (Simple Analogy)
Think of a confusion matrix like a grading system:
- Rows = Reality (actual results)
- Columns = Predictions (model guesses)
Every prediction falls into one of four categories:
- Correct positive
- Correct negative
- Wrong positive
- Wrong negative
👉 It’s essentially a report card for your AI model
Another way to think about it:
- The model is “taking a test”
- The confusion matrix shows exactly which questions it got right or wrong
How a Confusion Matrix Works (Step-by-Step)
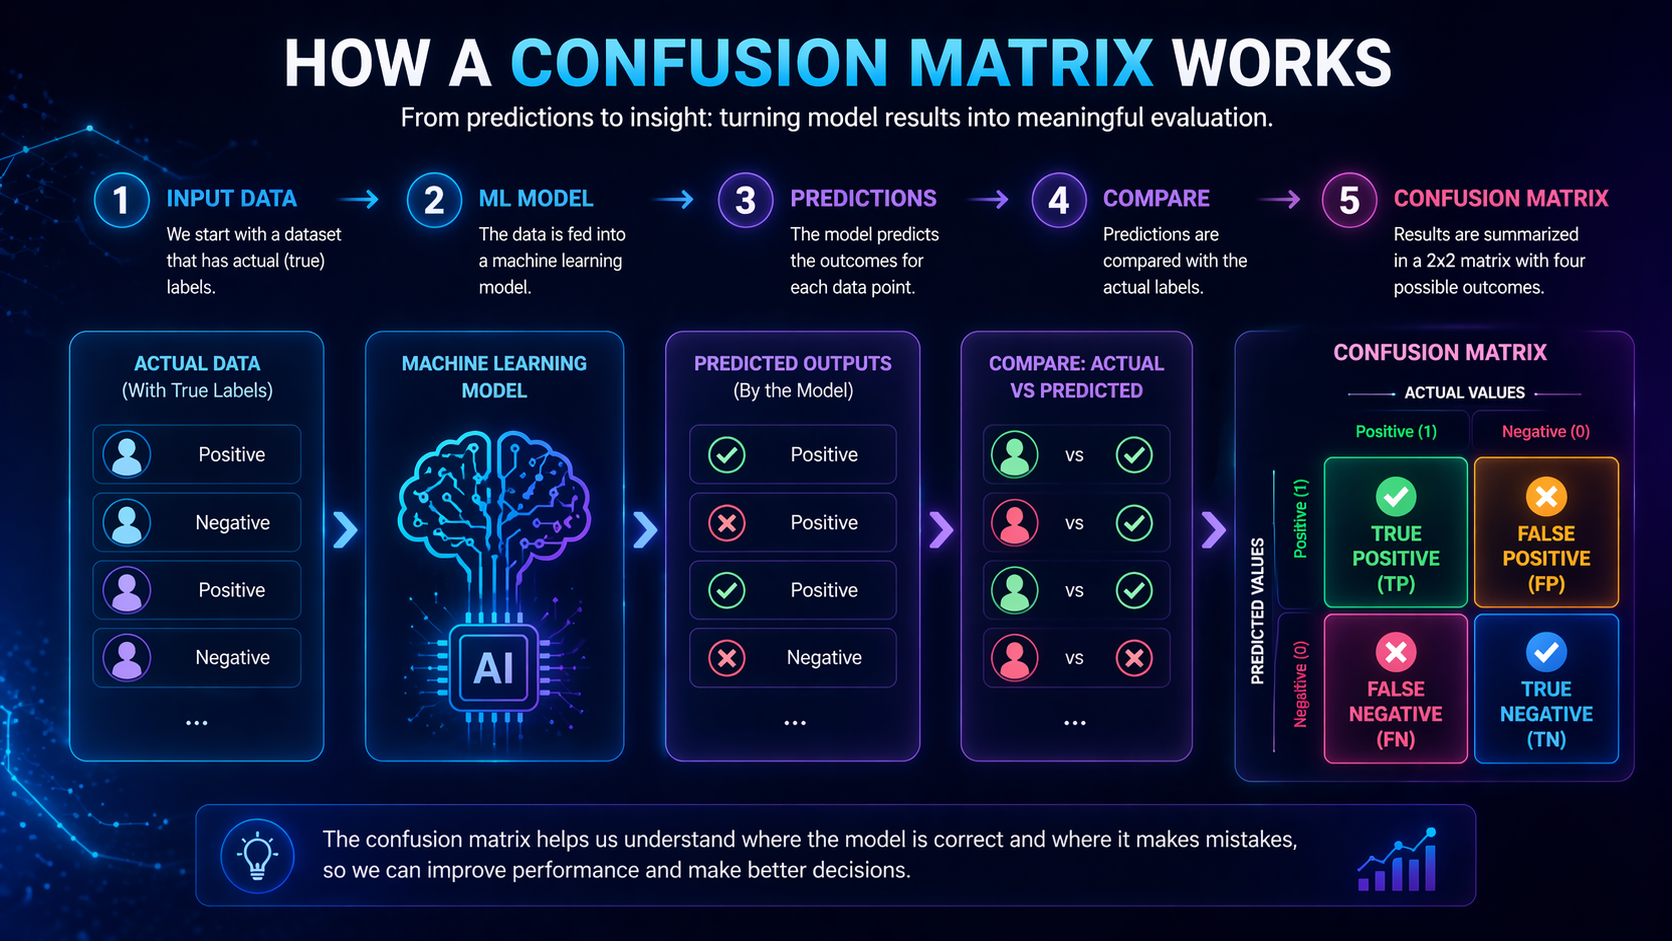
Example: Email Spam Detection
We build a model that predicts:
- Spam (Positive)
- Not Spam (Negative)
Step 1: Model Makes Predictions
The model analyzes emails and labels each one based on patterns it has learned from training data.
Step 2: Compare with Actual Results
Each prediction is compared with the true label (what the email actually is).
Step 3: Fill the Matrix
| Predicted Spam | Predicted Not Spam | |
| Actual Spam | 40 (TP) | 10 (FN) |
| Actual Not Spam | 5 (FP) | 45 (TN) |
Step 4: Interpret the Results
- True Positives (TP): Correctly identified spam
- True Negatives (TN): Correctly identified non-spam
- False Positives (FP): Normal emails marked as spam
- False Negatives (FN): Spam emails missed
From this, we can already see:
- The model is good at detecting spam
- But it still misses some spam emails (FN)
How to Interpret a Confusion Matrix in Practice
Understanding the numbers is one thing—interpreting them is where real value comes in.
When False Positives Matter More
Example: Spam filtering
- FP = important email marked as spam
- 👉 This hurts user experience
When False Negatives Matter More
Example: Medical diagnosis
- FN = disease goes undetected
- 👉 This can be dangerous or life-threatening
Choosing the “Best Model” Depends on Context
There is no perfect model.
Instead, the goal is to:
- 👉 Minimize the most costly type of error
This is why confusion matrices are so powerful—they let you align model performance with real-world priorities.
Key Concepts Beginners Must Understand
True Positives (TP)
Correctly predicted positive cases.
True Negatives (TN)
Correctly predicted negative cases.
False Positives (FP)
Incorrectly predicted positive (Type I Error).
False Negatives (FN)
Missed positive cases (Type II Error).
Why These Matter
Not all mistakes are equal:
- False Positive → Annoying
- False Negative → Dangerous
👉 Always ask: Which error matters more in your problem?
Confusion matrices help reduce overfitting and improve machine learning model performance by providing deeper insight into prediction errors and classification accuracy.
Derived Metrics from a Confusion Matrix
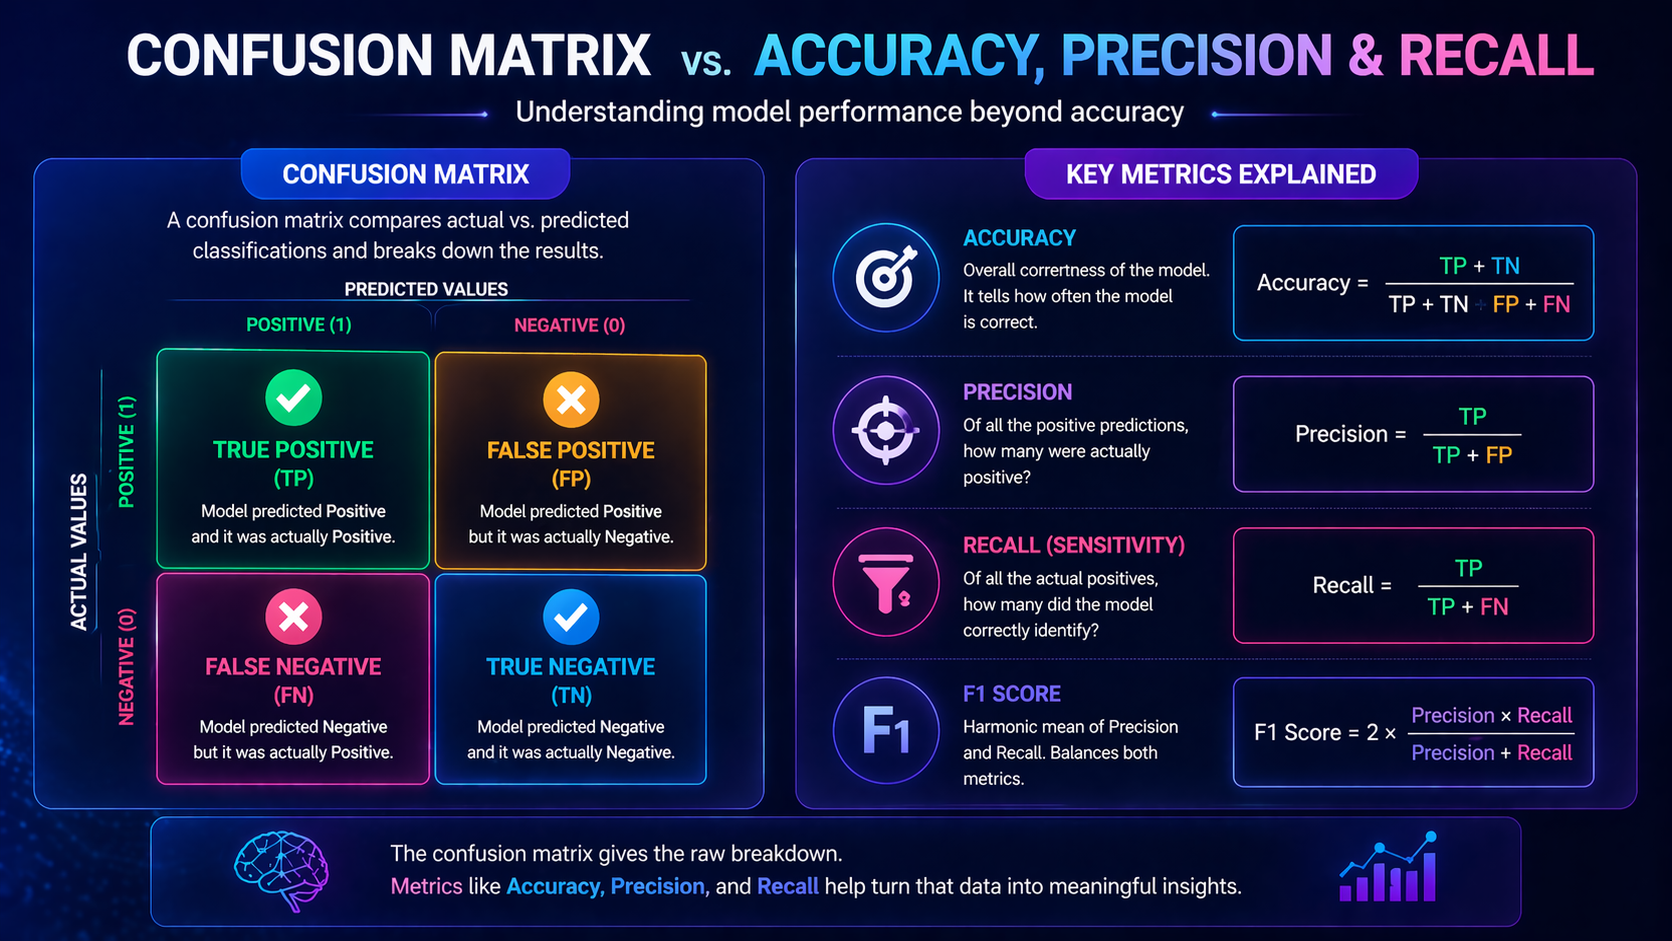
A confusion matrix is the foundation for many important evaluation metrics.
Precision
“When the model predicts YES, how often is it correct?”
Example:
If a fraud detection system flags 100 transactions and only 80 are actually fraud:
👉 Precision = 80%
Recall
“How many real YES cases did the model catch?”
Example:
If there are 100 fraudulent transactions and the model catches 80:
👉 Recall = 80%
F1 Score
A balance between precision and recall.
It is useful when:
- You need both accuracy and completeness
- You want a single metric combining both
👉 Related articles:
- Accuracy vs Precision vs Recall
- F1 Score Explained
Why a Confusion Matrix Is Better Than Accuracy Alone
Accuracy only tells you:
👉 “How many predictions were correct overall”
But it doesn’t tell you:
- What kind of mistakes were made
- Whether important cases were missed
Example: Imbalanced Dataset
Imagine:
- 95% of emails are NOT spam
- Model predicts “Not Spam” every time
👉 Accuracy = 95%
👉 But the model is useless
A confusion matrix reveals this problem instantly.
Types of Confusion Matrices
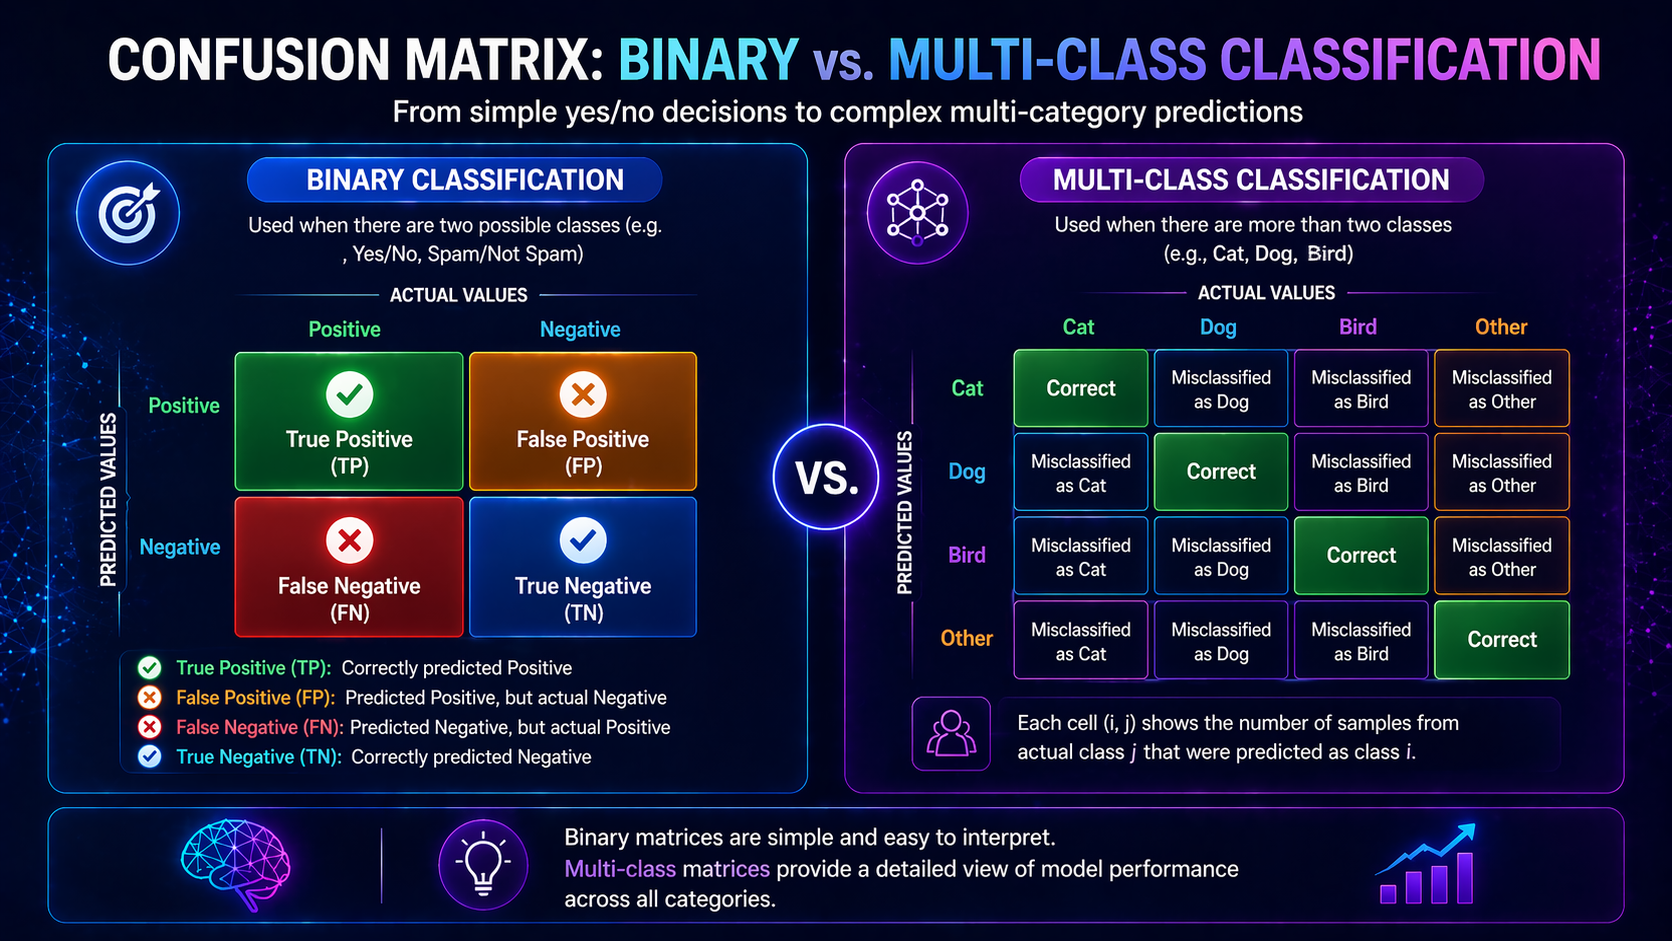
Binary Confusion Matrix
Used when there are two classes.
Multi-Class Confusion Matrix
Used when there are multiple classes (e.g., image classification).
Instead of a 2×2 table, it becomes a larger grid where:
- Each row = actual class
- Each column = predicted class
Real-World Applications
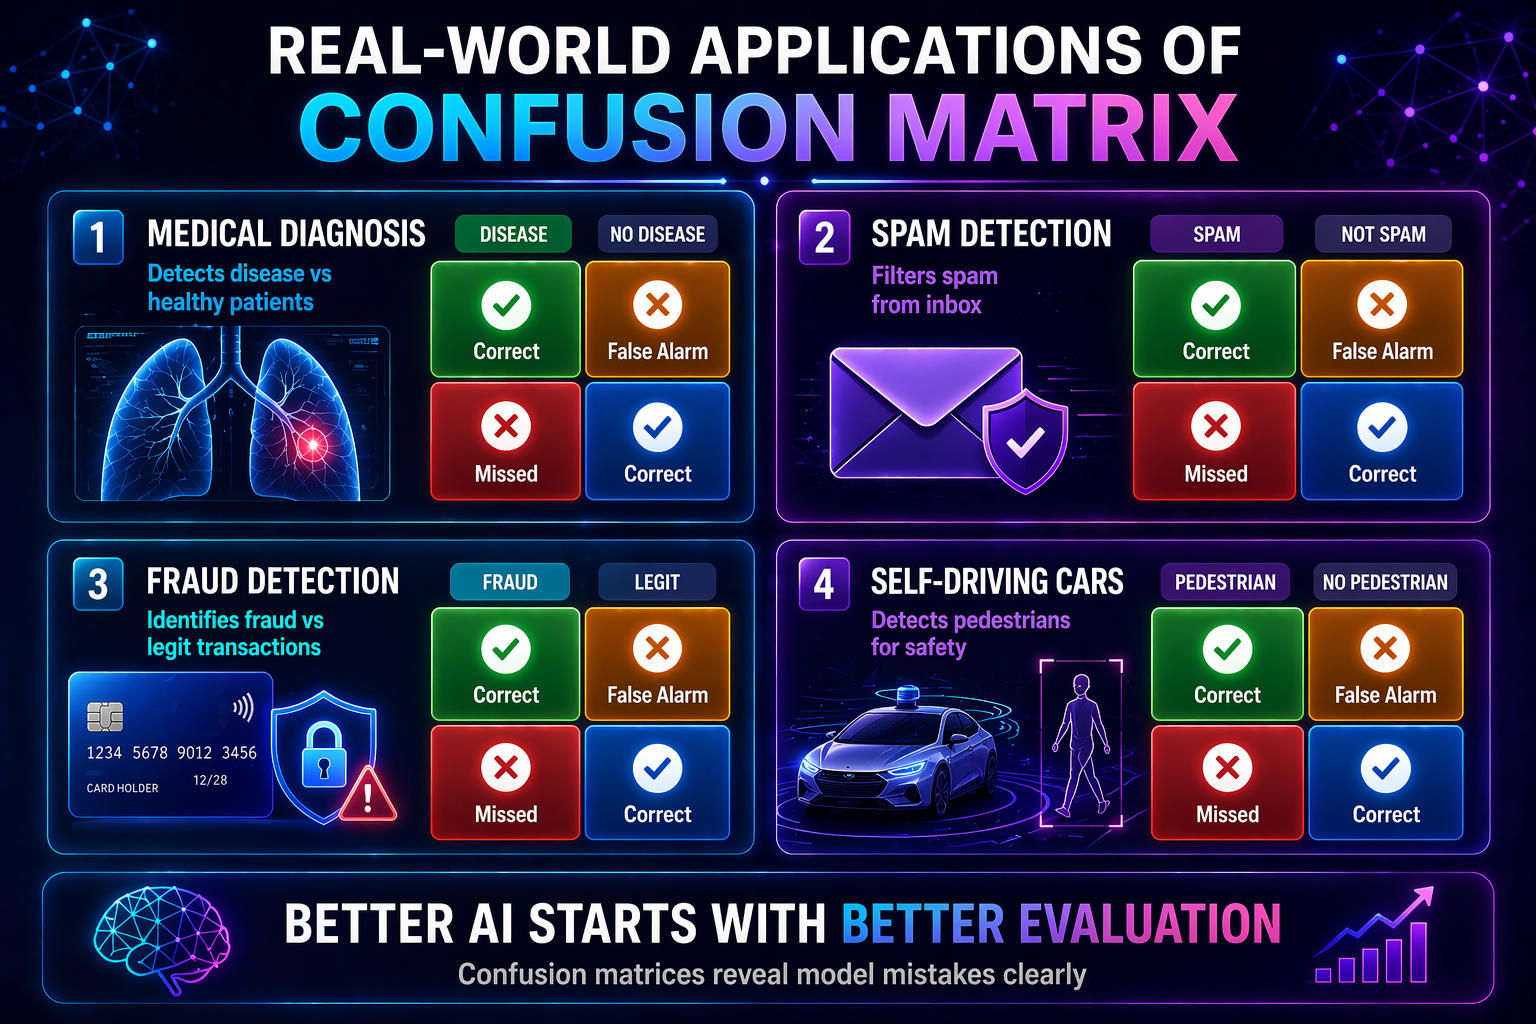
Healthcare
Used for disease detection models.
👉 Key priority: Reduce false negatives
Missing a disease can have serious consequences.
Fraud Detection
Used in banking and finance.
👉 Key challenge:
- Catch fraud (high recall)
- Avoid blocking real users (low false positives)
Spam Filtering
Used in email systems.
👉 Key priority:
- Avoid flagging important emails as spam.
Autonomous Vehicles
Used in object detection systems.
👉 Example:
- Detect pedestrians
- Avoid missing obstacles
AI Hiring Systems
Used to classify resumes or candidates.
👉 Important:
- Avoid biased or unfair misclassification.
Common Mistakes Beginners Make
Only Looking at Accuracy
Accuracy alone can be misleading.
Ignoring Class Imbalance
Uneven data can distort results.
Confusing FP vs FN
They have very different consequences.
Ignoring Real-World Impact
Always tie errors to business or real-world outcomes.
Advantages of a Confusion Matrix
- Full transparency
- Helps improve models
- Foundation for other metrics
- Easy to understand
Limitations of a Confusion Matrix
- Not a single score
- Can mislead with imbalanced data
- Complex in multi-class scenarios
Confusion Matrix vs Other Evaluation Metrics
| Metric | What It Measures | Limitation |
| Accuracy | Overall correctness | Can hide errors |
| Precision | Positive prediction quality | Ignores missed cases |
| Recall | Detection ability | Ignores false positives |
| F1 Score | Balance | Less intuitive |
| Confusion Matrix | Full breakdown | Requires interpretation |
Future Outlook of Confusion Matrices
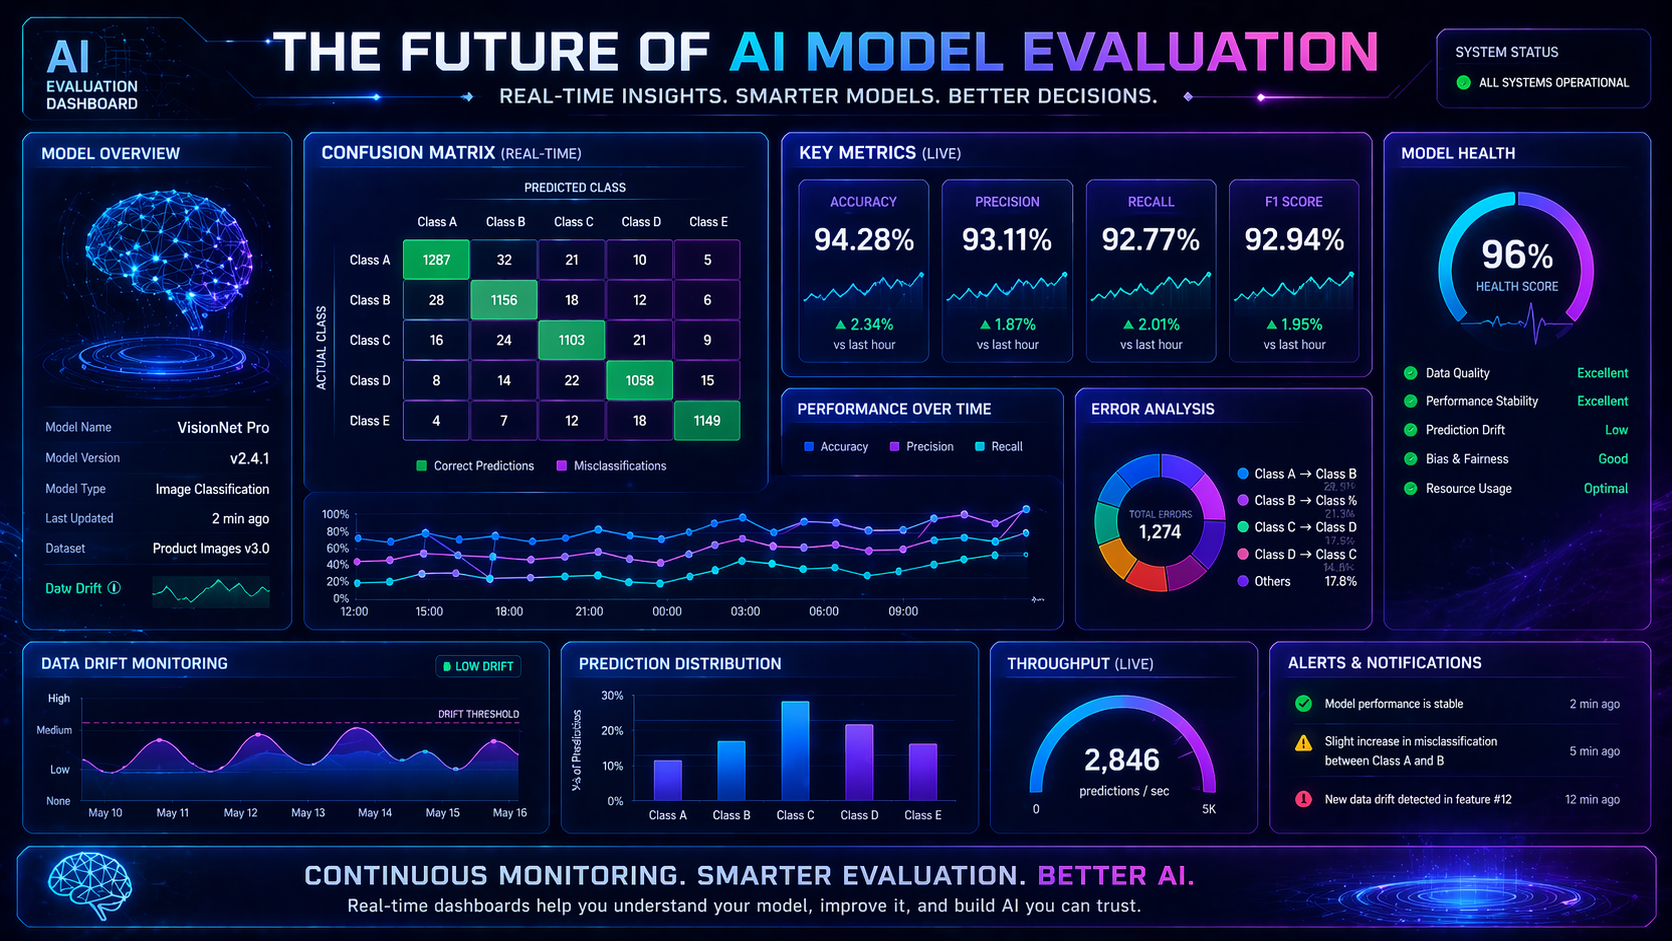
Better Visualization Tools
Interactive dashboards and heatmaps.
Deep Learning Integration
Widely used in vision and NLP systems.
AutoML Integration
Built into automated pipelines.
FAQ: Confusion Matrix Explained
What is a confusion matrix in simple terms?
A confusion matrix is a table that shows how well a classification model performs by comparing predictions with actual results.
Why is a confusion matrix important?
It helps you understand not just how accurate a model is, but also what kinds of mistakes it makes.
How do you read a confusion matrix?
You read it by comparing actual values (rows) with predicted values (columns) to see correct and incorrect predictions.
What is the difference between false positive and false negative?
A false positive is a wrong “YES” prediction, while a false negative is a missed “YES” case.
Is a confusion matrix better than accuracy?
Yes, because it shows detailed errors, while accuracy only gives an overall score.
Can you calculate accuracy from a confusion matrix?
Yes, accuracy is calculated using all four values: TP, TN, FP, and FN.
What is a confusion matrix used for in real-world AI?
It is used to evaluate models in areas like healthcare, fraud detection, and spam filtering.
Is a confusion matrix used in deep learning?
Yes, it is widely used in classification tasks such as image recognition and NLP.
What tools can create a confusion matrix?
Common tools include Scikit-learn, TensorFlow, and PyTorch.
What is a good confusion matrix?
A good confusion matrix has high true positives and true negatives, with low false positives and false negatives.
External Resources
- Learn more from IBM’s guide to confusion matrices
- Explore Google’s Machine Learning Crash Course on classification metrics
Explore More Model Evaluation Guides
If you want to continue learning about confusion matrices, prediction errors, and machine learning evaluation systems, explore these beginner-friendly guides covering datasets, classification metrics, neural networks, and model optimization.
Artificial Intelligence Foundations
👉 Artificial Intelligence Explained
Data & Training
👉 What Is a Dataset in Machine Learning
👉 Data Preprocessing Explained
👉 Feature Engineering Explained
Model Evaluation & Optimization
👉 Model Evaluation Metrics Explained
👉 Accuracy vs Precision vs Recall
Neural Networks & Deep Learning
👉 Deep Learning vs Machine Learning
Conclusion
A confusion matrix gives you a complete picture of model performance.
It helps you:
- Understand errors
- Improve predictions
- Make smarter decisions
If you master confusion matrices, you move from beginner to practical, real-world AI thinking.