
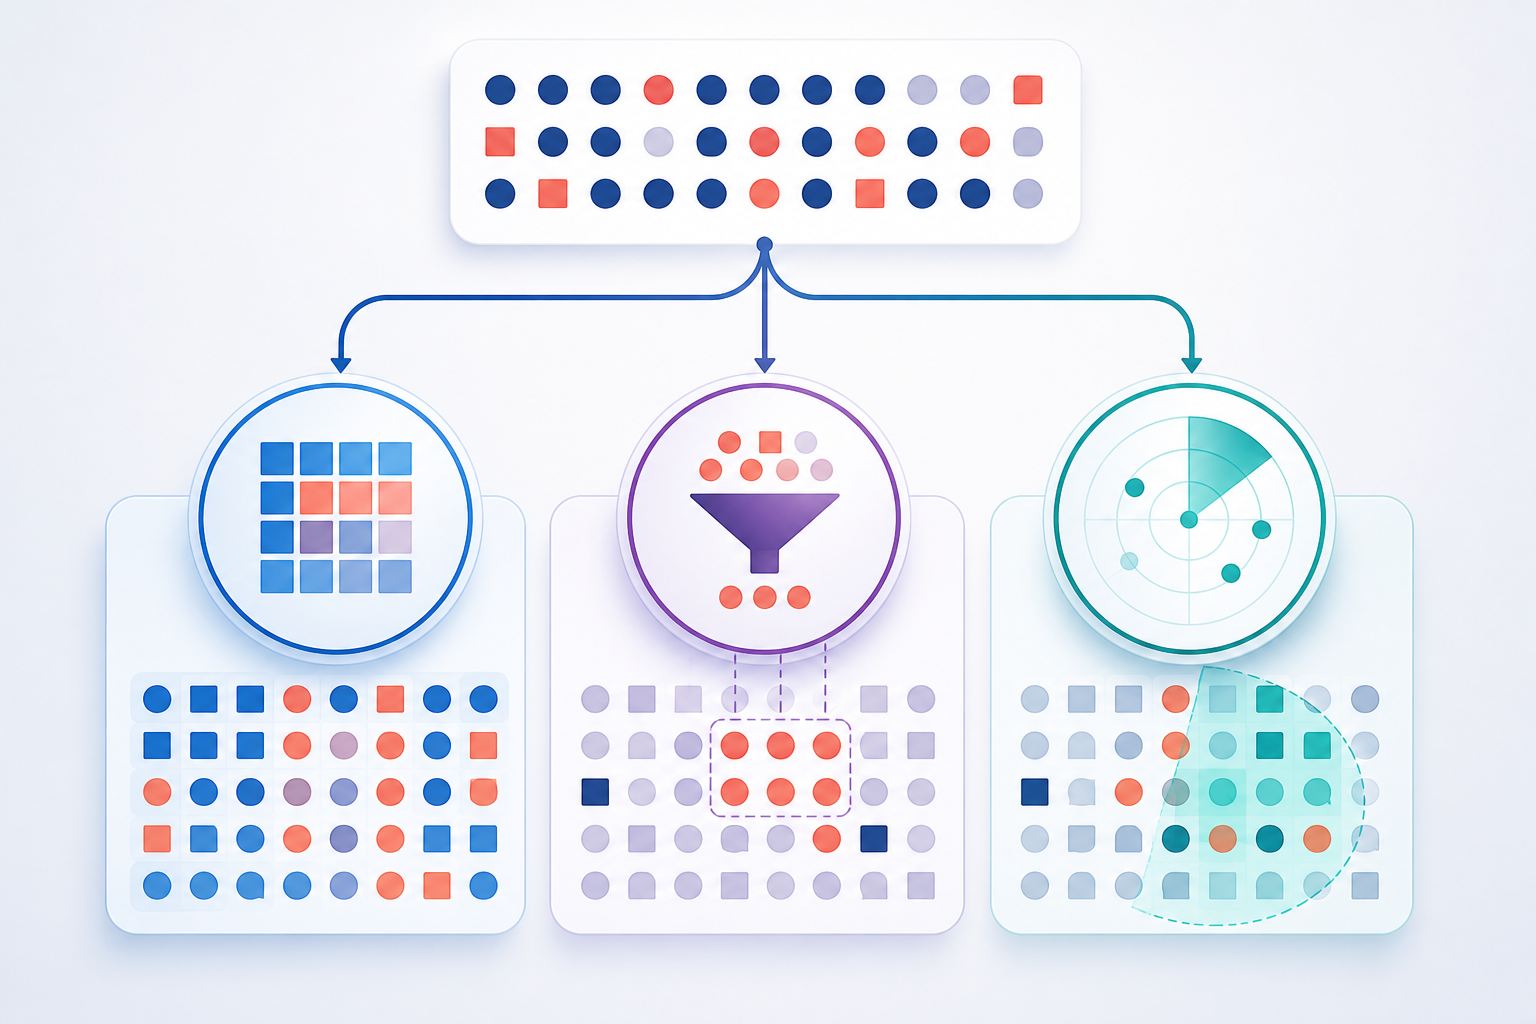
Accuracy, precision, and recall describe different parts of a classification model’s performance. Accuracy measures overall correctness, precision measures how reliable positive predictions are, and recall measures how many actual positive cases the model finds.
Updated:
This guide compares all three metrics using the same 100-email spam-filter example. Keeping the data constant makes it easier to see what each metric reveals—and what it leaves out.
Accuracy vs precision vs recall at a glance
On a phone: swipe horizontally to view every column.
| Metric | Question it answers | Formula | Most affected by |
|---|---|---|---|
| Accuracy | How many predictions were correct overall? | (TP + TN) / Total | All correct and incorrect predictions |
| Precision | When the model predicts positive, how often is it correct? | TP / (TP + FP) | False positives |
| Recall | Of all actual positives, how many did the model find? | TP / (TP + FN) | False negatives |
Start with one confusion matrix
Suppose we test a spam filter on 100 emails. We define spam as the positive class and not spam as the negative class. The model produces:
| Actual class | Predicted spam | Predicted not spam | Total |
|---|---|---|---|
| Actual spam | 40 True positives | 10 False negatives | 50 |
| Actually not spam | 5 False positives | 45 True negatives | 50 |
| Total | 45 | 55 | 100 |
If true positives, false positives, true negatives, and false negatives are unfamiliar, review Confusion Matrix Explained first.
Accuracy: overall correctness
Accuracy is the proportion of all predictions that are correct.
Accuracy = (TP + TN) / (TP + TN + FP + FN)
(40 + 45) / 100 = 85%
The spam filter correctly classifies 85 of the 100 emails. That summary is useful, but it does not distinguish between legitimate emails incorrectly sent to spam and spam emails incorrectly allowed into the inbox.
When accuracy is useful
Accuracy can be informative when classes are reasonably represented and the different errors have similar consequences. Even then, it should usually be reported with class-specific metrics rather than used alone.
When accuracy can mislead
Imagine that only 5 of 100 emails are spam. A model that predicts “not spam” every time is 95% accurate but catches none of the spam. Its recall is 0%.
Because the model never predicts spam, its precision is mathematically undefined: TP + FP equals zero, so the formula becomes 0 / 0. Some software reports zero after applying a configurable zero-division rule, but zero is not the underlying mathematical result.
Precision: reliability of positive predictions
Precision looks only at the cases predicted as positive. It asks how many of those positive predictions are correct.
Precision = TP / (TP + FP)
40 / (40 + 5) = 88.9%
Of the 45 emails sent to the spam folder, 40 are truly spam. Higher precision means a smaller share of legitimate emails is incorrectly flagged.
Precision becomes especially relevant when false positives are expensive. The appropriate target still depends on the full workflow: whether flagged items receive human review, how often the positive class occurs, and what happens after a positive prediction.
Recall: coverage of actual positives
Recall—also called sensitivity or the true positive rate—looks at all actual positive cases. It asks how many the model successfully identifies.
Recall = TP / (TP + FN)
40 / (40 + 10) = 80%
The model catches 40 of the 50 spam emails and misses 10. Higher recall means fewer actual positives are missed.
Recall matters when false negatives carry serious costs, but maximizing recall without considering false positives can make a system impractical. High-impact uses also require calibration, subgroup analysis, data-quality review, appropriate human oversight, and domain-specific safeguards.
How decision thresholds affect precision and recall
Many classifiers first output a score or probability. A decision threshold converts that score into a class label.
- Lowering the threshold usually predicts more positives. Recall often increases, while false positives can increase and precision can decrease.
- Raising the threshold usually predicts fewer positives. False positives often decrease, while false negatives can increase and recall can decrease.
This is a threshold tradeoff for the same model—not a law that prevents both metrics from improving. A better model can improve precision and recall together.
How to choose the right metric
Start with the decisions the model supports and the consequences of its mistakes:
- Define the positive class clearly.
- Measure how common each class is in representative data.
- Describe the consequences of false positives and false negatives.
- Decide whether predictions trigger an automatic action or human review.
- Compare metrics across reasonable thresholds.
- Confirm performance on untouched test data and relevant subgroups.
Accuracy is a broad summary. Precision emphasizes false positives. Recall emphasizes false negatives. In practice, responsible evaluation usually reports several metrics and explains why particular thresholds were chosen.
Where F1 score fits
F1 is the harmonic mean of precision and recall:
F1 = 2 × (precision × recall) / (precision + recall)
For this example, F1 ≈ 84.2%.
F1 penalizes a large imbalance between precision and recall, but it does not use true negatives. It is not automatically the correct metric for every problem. For a wider comparison of classification, regression, ranking, and calibration measures, continue to Model Evaluation Metrics Explained.
Frequently asked questions
Can accuracy be high while recall is low?
Yes. This often happens when the positive class is rare. A model can correctly predict the common negative class most of the time while missing many positives.
Is precision always the opposite of recall?
No. Adjusting a threshold often trades one against the other, but better data, features, or models can improve both.
Should I report only the best metric?
No. Report the metrics that describe the relevant errors, class distribution, and decision threshold. A single score can hide important weaknesses.
Sources and further reading
- Google Machine Learning Crash Course: Accuracy, precision, recall, and related metrics
- scikit-learn: Classification metrics
What to learn next
You now know what accuracy, precision, and recall measure and why they can disagree. Continue to Model Evaluation Metrics Explained to place them alongside F1, ROC-AUC, PR-AUC, regression metrics, and calibration.