
K-Nearest Neighbors (KNN) is a supervised machine-learning method that predicts an outcome from the labeled examples closest to a new data point. It can classify categories or estimate numerical values without fitting a conventional parametric model.
The idea is intuitive: nearby examples get a vote. But useful KNN results depend on how “nearby” is defined, which features are included, how those features are scaled, and how the value of K is selected.
Parent lesson: Supervised Learning Explained introduces the labeled-data learning framework that KNN uses.
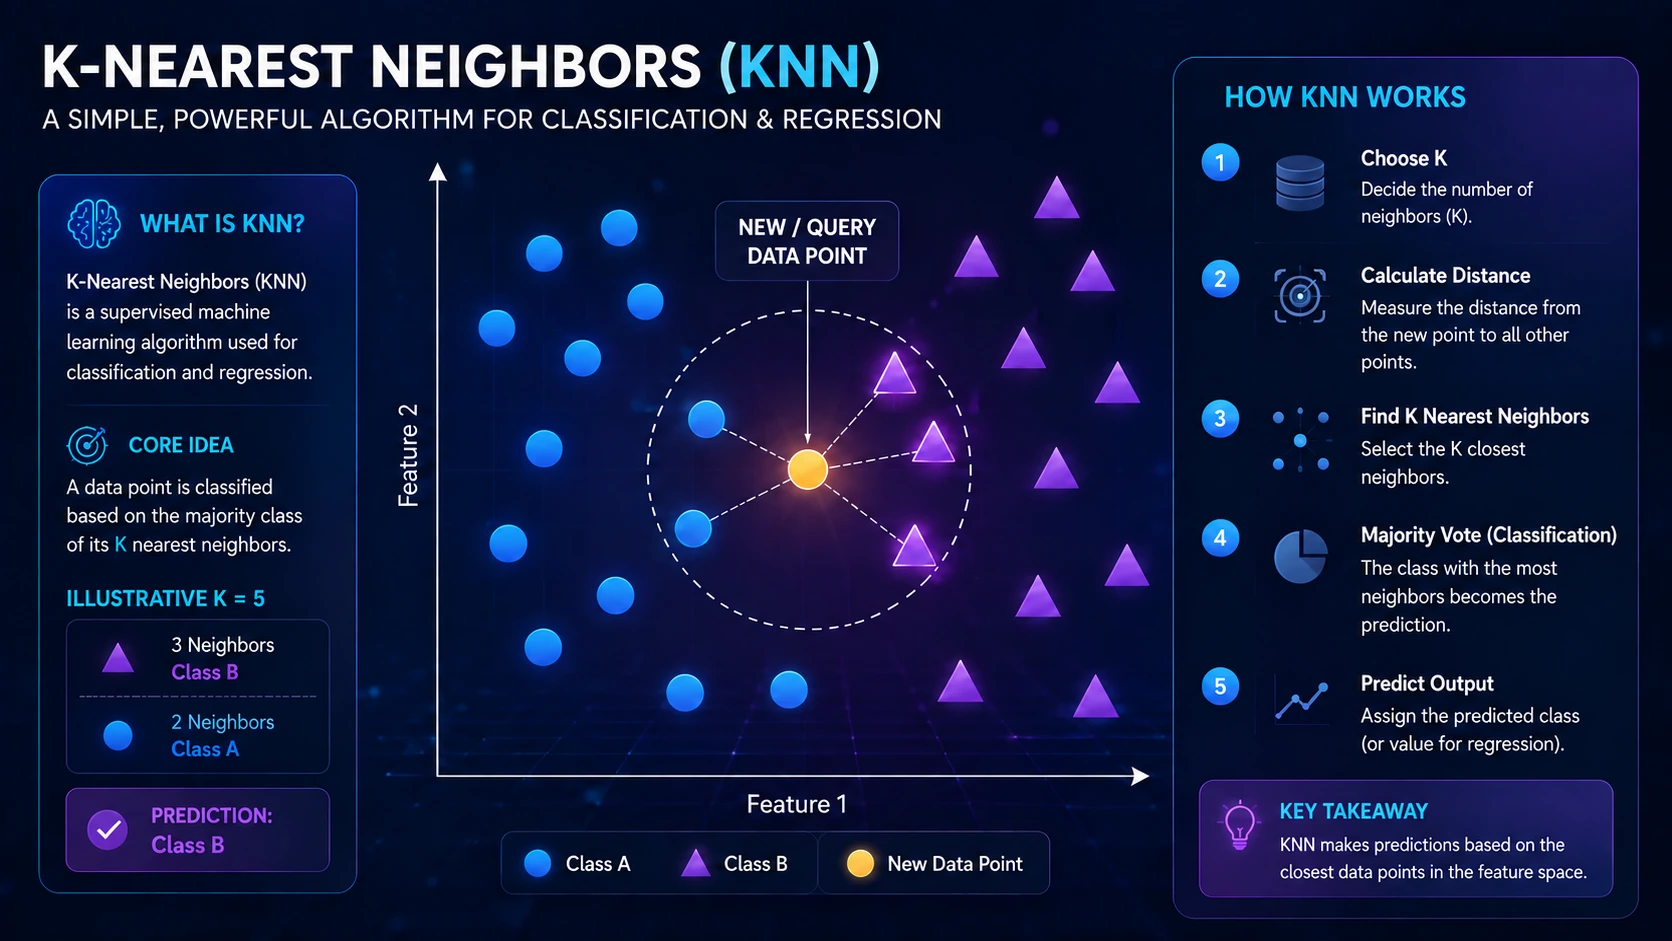
How K-Nearest Neighbors works
KNN is often called instance-based or lazy learning. It is also non-parametric: it does not assume a fixed functional form with a fixed number of learned parameters, instead relying on stored examples. Training mainly consists of retaining the prepared examples. Most computation happens when a prediction is requested, which makes fitting inexpensive but prediction potentially slow and memory-intensive.
Classification and regression
KNN classification predicts a category. If five neighbors contain three blue labels and two orange labels, an unweighted majority vote predicts blue. A distance-weighted version can give closer neighbors more influence.
KNN regression predicts a number. If the nearest comparable homes sold for $300,000, $310,000, and $320,000, a simple unweighted estimate is their mean: $310,000. Distance weighting can again give the closest homes more influence.
For the broader distinction between these task types, read Classification and Regression in Machine Learning.
A small worked classification example
Suppose a new fruit has two numerical features—mass and sweetness—and the nearby labeled examples are:
- Neighbor 1: apple, distance 0.8
- Neighbor 2: apple, distance 1.0
- Neighbor 3: pear, distance 1.2
- Neighbor 4: pear, distance 2.0
- Neighbor 5: pear, distance 2.3
With K = 3, two of the three nearest examples are apples, so an unweighted classifier predicts apple. With K = 5, three of five are pears, so it predicts pear. This is why K is a model choice that must be validated rather than guessed.
How to choose K
A very small K can react strongly to noise or an unusual example. A much larger K creates a smoother decision boundary but can ignore useful local structure. Neither “always choose an odd number” nor a single rule of thumb identifies the best value.
Test a reasonable range of K values with a validation set or cross-validation, then compare the metric that fits the task. Classification may require more than accuracy when classes are imbalanced; regression commonly uses measures such as mean absolute error or root mean squared error. Keep the final test set untouched until the model choices are complete.
This connects directly to Overfitting vs Underfitting, Bias vs Variance, and Model Evaluation Metrics.
Distance metrics and feature scaling
Euclidean distance is the straight-line distance between numerical points. Manhattan distance adds the distance traveled along each feature axis. Other metrics can be useful, but the choice must match the representation and meaning of the data. A distance metric is useful only when closeness represents meaningful similarity for the prediction task.
Scale matters. If age ranges from 18 to 90 while annual income ranges from $20,000 to $200,000, raw income differences can dominate Euclidean distance. Standardization or another justified transformation helps prevent measurement units from deciding which neighbors appear closest.
Irrelevant or duplicated features can also distort distance. As dimensions increase, data becomes sparse and points may become similarly far apart—the curse of dimensionality—so feature selection, dimensionality reduction, or a different method may be necessary. See Data Preprocessing Explained and Feature Engineering Explained.
When KNN is a reasonable choice
KNN is most defensible when the dataset is not too large, a meaningful distance can be defined, relevant features are available, and similar examples are expected to have similar outcomes. It is useful as an interpretable baseline and for some small or moderate classification, regression, similarity, and recommendation problems.
Nearest-neighbor ideas also appear in retrieval and anomaly-detection systems, but those are not automatically the same as a standard supervised KNN classifier. Likewise, KNN may support research or decision-support workflows in healthcare, but an educational example does not establish clinical safety or suitability.
Swipe horizontally to view the full comparison.
| Area | Strength | Limitation or check |
|---|---|---|
| Learning curve | Intuitive and easy to inspect. | Simple logic does not remove the need for careful validation. |
| Training | Little conventional fitting is required. | The prepared training examples must be retained. |
| Prediction | Can model flexible local boundaries. | Distance calculations can be slow as the dataset grows. |
| Features | Works with a justified numerical representation. | Sensitive to scale, missing values, irrelevant features, and dimensionality. |
| Classes | Supports multiclass classification. | Imbalance, ties, and sparse local data require explicit handling. |
Common mistakes
- Scaling before the data split. This leaks information from validation or test data into training.
- Assuming all features are comparable. Units, encoding, missing values, and feature relevance affect the neighborhood.
- Choosing K on the test set. Use validation or cross-validation and reserve the test set for final evaluation.
- Ignoring class imbalance. A local vote can favor the majority class; inspect class-specific metrics and consider justified weighting or sampling.
- Using KNN at any scale. Exact searches can become expensive in both memory and prediction time.
- Treating proximity as explanation. Nearby examples show similarity in the chosen feature space, not causation.
KNN versus K-Means
The similar names describe different jobs. KNN is supervised: it uses labeled examples to predict a category or number. K-Means is unsupervised: it partitions numerical data into K clusters around centroids. In KNN, K means the number of neighbors; in K-Means, K means the number of clusters.
Read K-Means Clustering Explained for the complete clustering lesson.
Sources and further reading
- scikit-learn: Nearest Neighbors
- scikit-learn: Common pitfalls and recommended practices
- scikit-learn: Cross-validation
Frequently asked questions
Is KNN supervised or unsupervised?
Standard KNN classification and regression are supervised because they predict from labeled training examples. Related nearest-neighbor techniques can also support unsupervised tasks.
What is the best value of K?
There is no universal best value. Compare reasonable candidates through validation or cross-validation using a metric appropriate for the task.
Why can KNN be slow?
Prediction may require calculating distances to many stored examples. Search indexes or approximate-neighbor methods can help in some settings, but their usefulness depends on the data and dimensionality.
Can KNN use categorical data?
Only with a representation and distance measure that make the categories meaningfully comparable. Arbitrary integer codes can create false numerical distances.
Where to learn next
Next, compare this instance-based method with Naive Bayes, which uses class probabilities and a conditional-independence assumption to make predictions.