
Bias and variance describe two different ways a learning system can fail to generalize. High bias means the learning process is too constrained to capture useful structure. High variance means its result changes too much when the training sample changes.
The practical goal is not to make both quantities literally zero. It is to choose data, features, model capacity, regularization, and validation methods that produce reliable performance on relevant unseen cases.
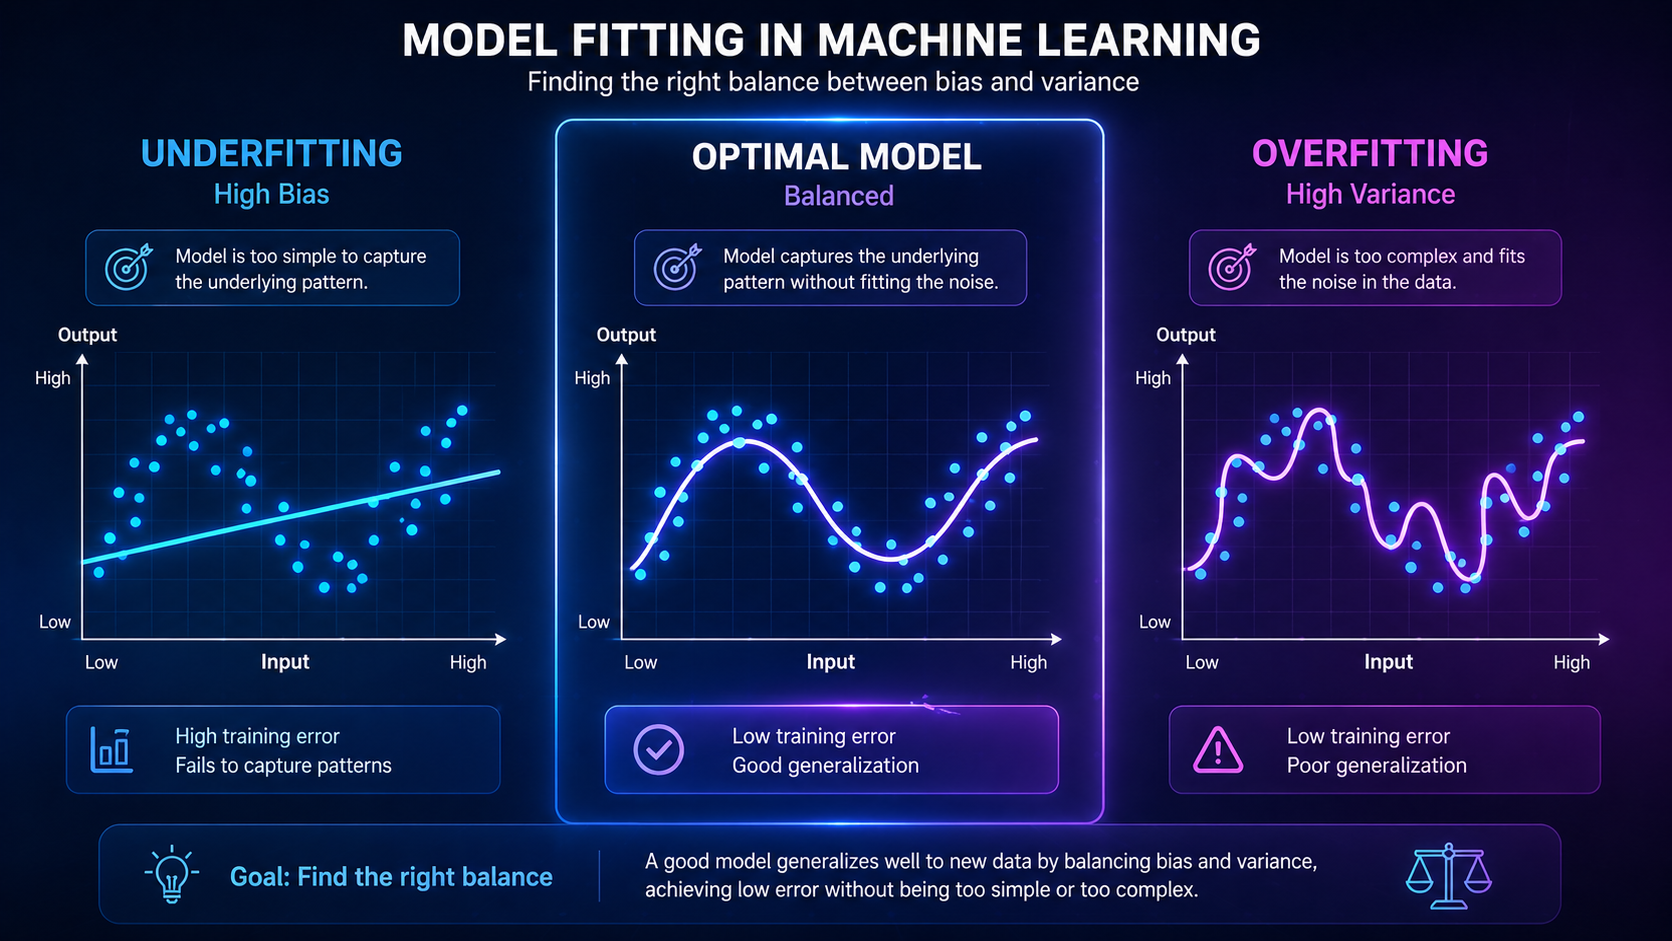
Bias and variance in plain language
Bias: error from restrictive assumptions
A learning procedure has high bias when its assumptions prevent it from representing an important relationship. For example, a straight-line model may miss a strongly curved pattern unless its inputs are transformed appropriately.
Possible clues include weak performance on both training and validation data, errors that persist across different samples, or learning curves that level off at an inadequate result. Those observations can suggest underfitting, but they do not prove bias is the only cause. Weak features, label noise, an unsuitable objective, or poor optimization can create similar symptoms.
Variance: sensitivity to the training sample
A learning procedure has high variance when small changes in the training data can produce meaningfully different fitted models or predictions. A highly flexible system may learn accidental details that do not repeat in new data.
A strong training result paired with a substantially weaker validation result can suggest excessive variance or overfitting. Before accepting that diagnosis, check for leakage, duplicate records, a small or unrepresentative validation sample, distribution shift, and metric instability.
Swipe horizontally to view the full comparison.
| Pattern | What it means | Possible evidence | Useful response |
|---|---|---|---|
| Higher bias | Important structure is consistently missed. | Training and validation results are both inadequate. | Improve representations, optimization, objective, or justified model capacity. |
| Controlled generalization | The learned pattern is useful on relevant unseen data. | Validation performance is operationally useful and stable. | Stress-test, estimate uncertainty, and monitor after deployment. |
| Higher variance | The fitted result is too sensitive to the sample. | Training is strong while validation is weaker or unstable. | Improve data, regularize, simplify, ensemble, or stop training earlier when appropriate. |
Why “tradeoff” does not mean one fixed formula
In the classical squared-error setting, expected prediction error can be described using squared bias, variance, and irreducible noise. Increasing flexibility may reduce bias while increasing variance, which creates the familiar U-shaped test-error illustration.
That picture is a useful teaching model—not a law that assigns every algorithm a permanent position. A linear model can have low bias when the relationship is approximately linear. A tree can be heavily constrained. A neural network can generalize well because of its data, pretraining, architecture, regularization, and optimization. Model-family labels alone do not diagnose bias or variance.
A practical diagnostic example
Suppose the same modeling workflow is evaluated across several representative training samples:
A single train/test split cannot directly measure the full bias–variance decomposition. It can provide clues. Repeated resampling, learning curves, validation curves, and carefully designed test sets provide stronger evidence.
How to respond without guessing
When the evidence suggests excessive bias
- Confirm that the metric and objective reflect the real task.
- Improve features or representations using training data only.
- Check whether optimization ended too early or used unsuitable settings.
- Reduce excessive regularization.
- Increase model capacity when simpler explanations have been ruled out.
When the evidence suggests excessive variance
- Collect more relevant, representative data when limited coverage is the cause.
- Correct leakage, duplicate records, label errors, and unstable sampling.
- Use appropriate regularization or simplify unnecessary complexity.
- Use early stopping for iterative training.
- Consider bagging or another ensemble method when it fits the model and task.
- Use cross-validation to estimate sensitivity more reliably—not as a cure by itself.
Change one important factor at a time and reevaluate. More data will not fix the wrong objective, systematic label errors, leakage, or a mismatch between the training population and real use.
Do not confuse statistical bias with fairness
In this lesson, bias refers to systematic prediction error created by the assumptions of a learning procedure. Discussions of algorithmic fairness use the same word for disparities, representation problems, or harmful outcomes affecting groups. The concepts can interact, but reducing statistical bias does not automatically make a system fair.
Connection to overfitting and underfitting
High bias is often associated with underfitting, while high variance is often associated with overfitting. The relationship is helpful for diagnosis, but real systems can show both problems, different behavior across subgroups, or failure caused by data shift rather than either pattern alone.
For the observable training and validation patterns, revisit Overfitting vs Underfitting. To choose measurements that match the decision, use Model Evaluation Metrics Explained. For reliable splits and leakage prevention, see Training vs Testing Data.
Sources and further reading
- scikit-learn: Validation curves and learning curves
- scikit-learn: Underfitting versus overfitting example
- Google Machine Learning Crash Course: Overfitting
Where to learn next
Put the concept into practice by learning how to select evidence that reflects the real prediction goal.